

Drilling Down on Intuit’s Bookkeeping Survey Results: Regions, Population Density, and States
By Bill Teague
In Intuit’s second early report we drill down on the results of Intuit’s Bookkeeping Rates survey based on location.
Before we show you the results in terms of region, population density, and state, please be aware that the size of our sample this year allowed us to do something we have never done before. That is, we will now include our results for all states. This is the first time we have done so. While some states have small samples, we still think the results will be of interest.
NOTE: For the final, consolidated results and a link to download an Excel file with the tables, see this post on Intuit ProLine News Central Blog. Download a PDF Intuit’s Average Billing Rates Survey 2011 .
Also before we share the results based on locations, we wanted to update our overview of national results.
UPDATED NATIONAL RESULTS
We further qualified responses and eliminated a number of responses based on internal inconsistency. As a result, the average rates did shift. Changes are shown below in bold red. The mode value, the most common amount charged, did not change, however. If hourly rates changed, they changed only by a dollar. Changes in fixed fees were by a larger amount. (This is in part because the sample for fixed fees is roughly a third of the size of the sample for hourly rates. A small change in the base for fixed fees has a bigger impact.)
National Hourly Rates in 2011
The majority of practitioners charge hourly rates. (Some also have services offered for set fees; see below).


National Fixed Fees in 2011 Survey
A sizable group of practitioners charge for services by fixed fees. Most of these respondents (but not all) also offer services on an hourly basis.


REGIONAL ANALYSIS
The regions listed here are those that were commonly self-provided in an early rates survey. It’s entirely possible that different practitioners in the same city might self-identify as being in different regions (such as Northeast and Atlantic). Please cross-check these regional rates and fees with data from the tables organized by state and population density that follow.
The highest rate in each table appears in bolded text.
Hourly Rates by Region


Fixed Fees by Region


POPULATION DENSITY
Population density remains a major factor in what rates are charged.
Rates by Population Density


Fixed Fees by Population Density


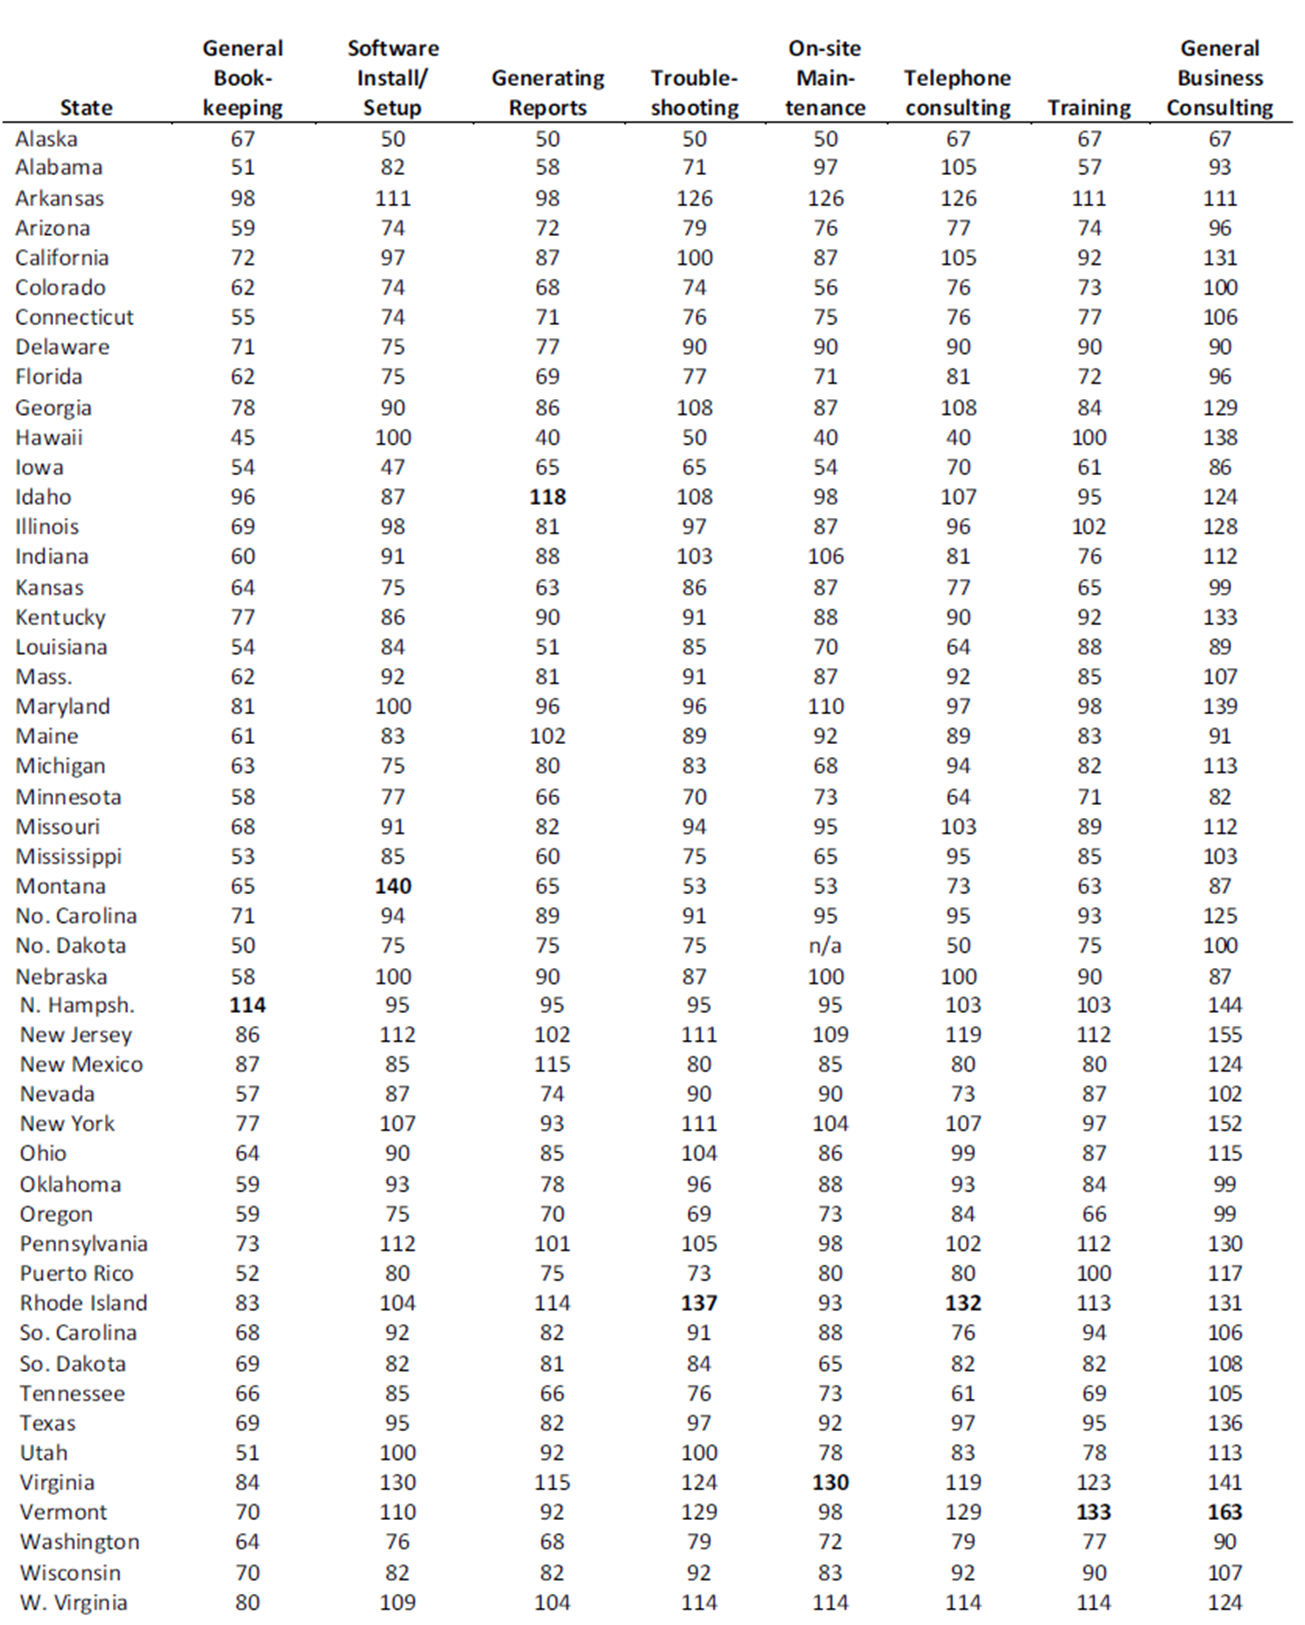
INDIVIDUAL STATES
Population density remains a major factor in what rates are charged. But as we are often asked for specifics at the state level, we are presenting results here as one more data point for you to consider. Please understand samples at the state level are often smaller than the other categories we have presented earlier. You should be more confident about results in the following twenty states, which had the largest number of responses.
The top ten states in terms of sample size, in alphabetical order, are California, Florida, Illinois, New Jersey, New York, Ohio, Pennsylvania, Texas, Washington, and Wisconsin.
The next top ten states in terms of sample size, again in alphabetical order, are Arizona, Colorado, Connecticut, Georgia, Kansas, Massachusetts, Maryland, Michigan, North Carolina, and Virginia.
Rates by Individual State
Note: Not represented are the District of Columbia and Wyoming.
Especially because there are fewer practitioner offering fixed fees than hourly rates, we have a number of states that are not represented: Arkansas, District of Columbia, Georgia, Idaho, Montana, New Hampshire, and Wyoming. As before, the data for some states is relatively thin, so take these amounts with a grain of salt.

Disclaimer
By conducting this survey as an informal, web-based straw poll, we are able to develop a large sample. We believe the results to be meaningful, if unscientific.
To the best of our knowledge, this is the largest ongoing survey conducted among QuickBooks practitioners and others on the rates they charge. We encourage you to use the survey results as one of many data points when you look at how you structure your rates and fees.
Bill Teague is a freelance writer and editor, and former Managing Editor of the Intuit® ProConnection® Newsletter.
Copyright © 2011 by Intuit Inc. All rights reserved.